How America's babies sleep
For the first time, Nanit has ranked all 50 states by infant sleep quality using real Sleep Score data from Nanit families across the country. Explore the map to see how babies in your state are sleeping—and discover what the data reveals about rest across America.
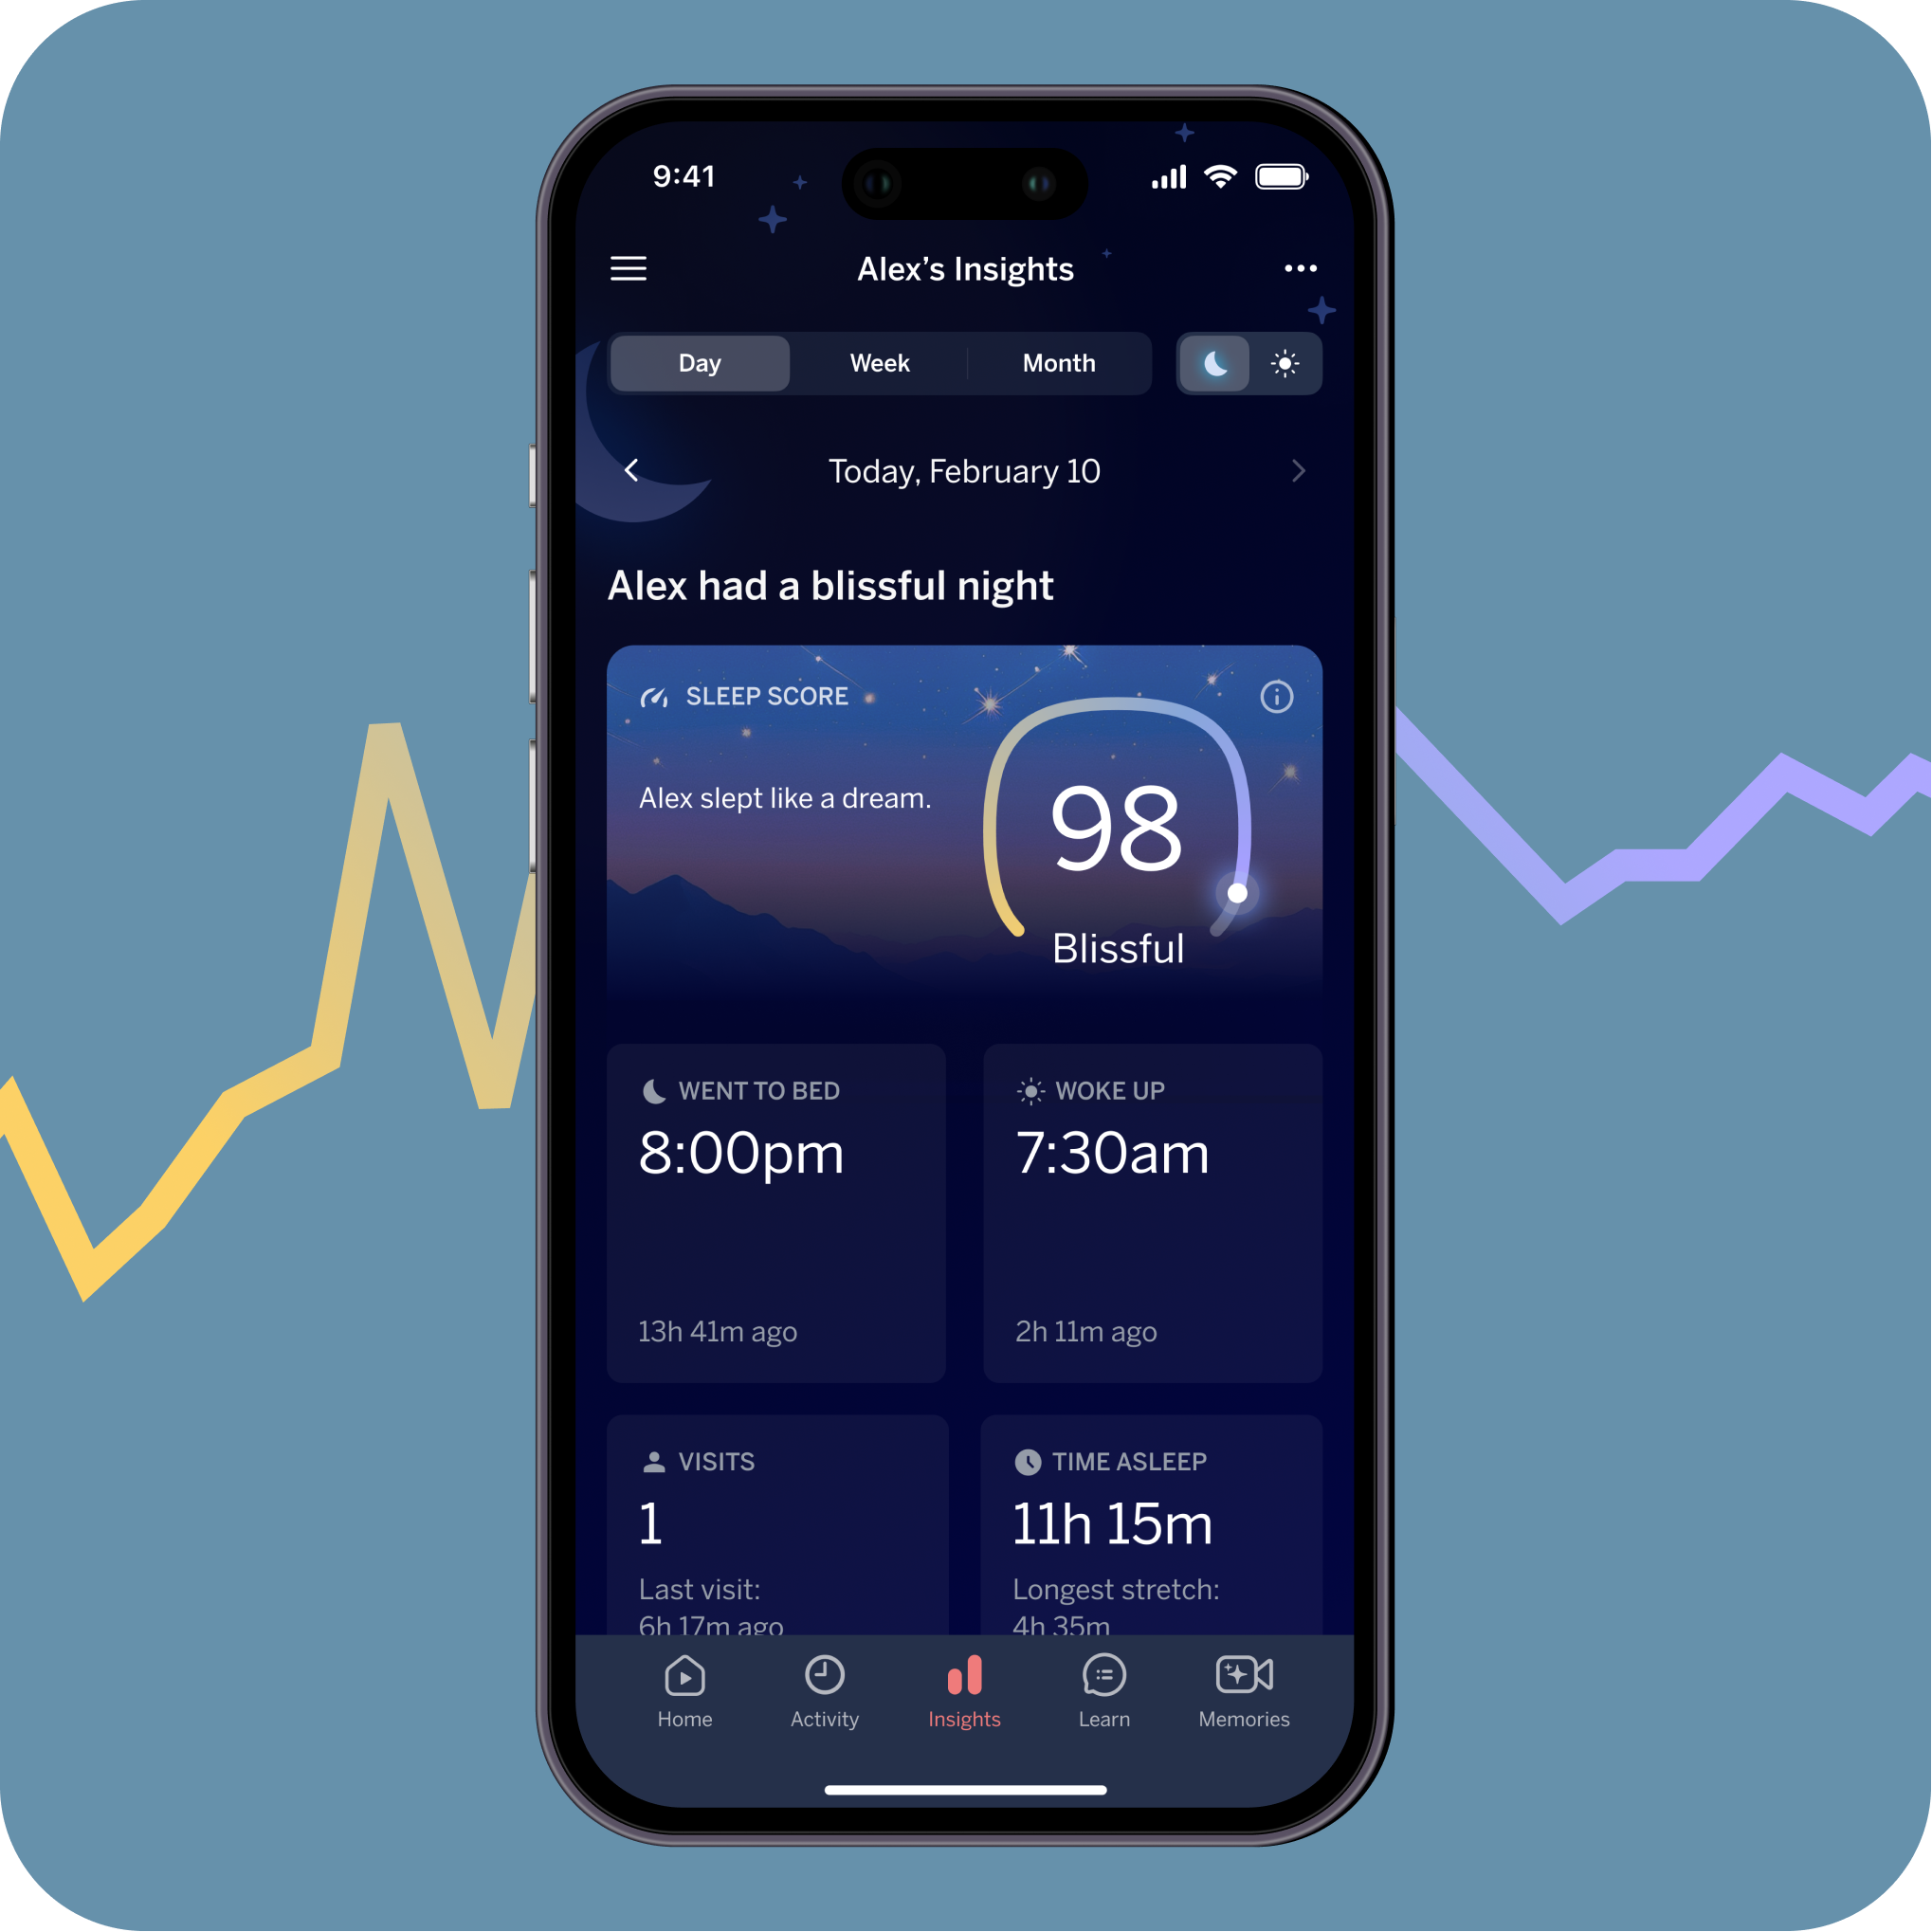
Every night, Nanit auto-captures incredibly detailed information about your baby's sleep quality. When your morning begins, all that complexity is transformed into a Sleep Score. Because babies change constantly, the same combination of sleep factors can look very different for a 2-month-old versus a 12-month-old—that's why Sleep Score was designed to adapt at every stage of development.
Keep in mind, "good sleep" isn't defined by hours alone. Sleep Score is built on four key components that sleep scientists consider essential for healthy rest:
Each factor is carefully weighted and combined to create one intuitive number that represents the night as a whole.
What Nanit’s Sleep Score reveals about infant sleep in the U.S.
Interpreting the data behind how America’s babies sleep
What a stronger score might reflect
A stronger Sleep Score doesn’t point to a single factor. It reflects a combination of things going right across the night. States that rank higher in the index tend to show consistent patterns across all four components that make up the score.
Because Sleep Score is age-adaptive, what “strong” looks like at 2 months is different from what it looks like at 8 months. But in each case, a higher score signals that a baby’s sleep is well-aligned with what’s healthy for their stage of development.
- Sleep Duration Babies are sleeping longer overall, with fewer gaps between rest periods through the night.
- Sleep Timing Bedtimes and wake times are consistent and aligned with biologically healthy rhythms for the baby’s age.
- Sleep Continuity Nights are smoother, with fewer awakenings and shorter windows of unsettled time between sleep bouts.
- Parent Visits Babies are settling more independently, requiring fewer overnight check-ins from a caregiver.
Key findings
-
The Northeast leads the nation, and the data points to why.
Maine, Massachusetts, Vermont, and New York all rank in the top 10. Northeastern states have among the highest rates of paid parental leave in the country, more pediatric healthcare providers per capita, and higher median household incomes, all factors associated with the consistent bedtime routines that research links to better infant sleep outcomes.
-
The Southeast outperforms expectations.
North Carolina, South Carolina, and Georgia all crack the top 10, likely helped by geography. The Southeast has among the earliest sunsets in the contiguous U.S. year-round, which supports earlier melatonin onset in infants. Earlier light cues make it significantly easier for families to establish and maintain early, consistent bedtimes.
-
The West and Mountain states struggle, and daylight is a real factor.
Alaska, Hawaii, Washington, and Idaho cluster at the bottom. Extended evening daylight in these states might suppress melatonin production in infants, delay sleep onset, and fragment nighttime sleep. Families here face a genuine biological headwind that even consistent routines can only partially overcome.
-
Rural states face a compound disadvantage.
North Dakota, South Dakota, Nebraska, and Iowa all rank in the bottom 10. Rural states have fewer pediatric providers per capita, less access to parental leave, and fewer lactation and sleep support resources, and parent education and support are among the strongest predictors of infant sleep outcomes.
-
Urban density is not the enemy of infant sleep.
Massachusetts, New York, and Washington D.C. all rank near the top, directly challenging the assumption that city living harms infant sleep. What urban environments offer — higher incomes, greater healthcare access, and stronger support networks — appears to more than compensate for the noise and irregular schedules of city life.
What parents should do with this information
The Nanit Lab Sleep Index isn’t designed to make parents feel like they’re winning or losing at sleep. It’s meant to help you understand the factors that influence your baby’s rest, and to give you a starting point for improvement, if that’s what you’re looking for.
Here are a few practical steps based on what the data reveals:
Prioritize consistent timing. Sleep timing, when your baby goes to bed and wakes up, is one of the strongest predictors of a healthy Sleep Score. Try to keep bedtime and wake time within the same 30-minute window each day.
Watch for continuity, not just duration. A baby who sleeps 10 hours with minimal waking may score higher than one who sleeps 11 hours but wakes frequently. Uninterrupted sleep matters.
Use check-ins as a signal, not a score. The number of times you visit your baby overnight tells you something about their ability to self-settle, but it’s also completely normal for younger babies to need support. Track the trend over time rather than fixating on any single night.
Let your baby’s age guide expectations. Sleep Score is built to adapt to your baby’s developmental stage. A score of 85 for a 2-month-old and a score of 85 for a 14-month-old represent very different sleep profiles, and that’s by design.
Simplify nights
with Sleep Score
As the first-ever holistic metric for infant sleep, Sleep Score translates complex nights into one, easy-to-read sleep health metric, delivered to you each morning in the Nanit app.
About Nanit Lab
We've put together a cutting-edge think tank of scientists, engineers, physicians, academic experts, and thought leaders to develop best-in-class research among three primary pillars: Sleep Health, Postpartum Anxiety & Depression, and Pediatric Health and Wellness.